Typical features of selected neurodegenerative diseases


Source: Sobański M, Zacharzewska-Gondek A, Waliszewska-Prosół M, Sąsiadek MJ, Zimny A, Bladowska J. A Review of Neuroimaging in Rare Neurodegenerative Diseases. Dement Geriatr Cogn Disord. 2021 Jan 28:1-13. doi: 10.1159/000512543 https://www.karger.com/Article/FullText/512543

Comparison of Manual Cross-Sectional Measurements and Automatic Volumetry of the Corpus Callosum, and Their Clinical Impact: A Study on Type 1 Diabetes and Healthy Controls


Background and purpose: Degenerative change of the corpus callosum might serve as a clinically useful surrogate marker for net pathological cerebral impact of diabetes type 1. We compared manual and automatic measurements of the corpus callosum, as well as differences in callosal cross-sectional area between subjects with type 1 diabetes and healthy controls.
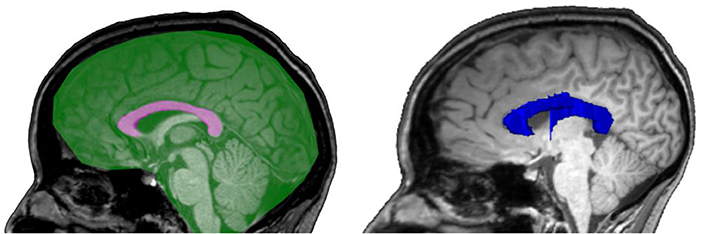
Materials and methods: This is a cross-sectional study on 188 neurologically asymptomatic participants with type 1 diabetes and 30 healthy age- and sex-matched control subjects, recruited as part of the Finnish Diabetic Nephropathy Study. All participants underwent clinical work-up and brain MRI. Callosal area was manually measured and callosal volume quantified with FreeSurfer. The measures were normalized using manually measured mid-sagittal intracranial area and volumetric intracranial volume, respectively.
Results: Manual and automatic measurements correlated well (callosal area vs. volume: ρ = 0.83, p < 0.001 and mid-sagittal area vs. intracranial volume: ρ = 0.82, p < 0.001). We found no significant differences in the callosal measures between cases and controls. In type 1 diabetes, the lowest quartile of normalized callosal area was associated with higher insulin doses (p = 0.029) and reduced insulin sensitivity (p = 0.033). In addition, participants with more than two cerebral microbleeds had smaller callosal area (p = 0.002).
Conclusion: Manually measured callosal area and automatically segmented are interchangeable. The association seen between callosal size with cerebral microbleeds and insulin resistance is indicative of small vessel disease pathology in diabetes type 1.

Reference: Claesson T, Putaala J, Shams S, Salli E, Gordin D, Liebkind R, Forsblom C, Summanen PA, Tatlisumak T, Groop P-H, Martola J and Thorn LM (2020) Comparison of Manual Cross-Sectional Measurements and Automatic Volumetry of the Corpus Callosum, and Their Clinical Impact: A Study on Type 1 Diabetes and Healthy Controls. Front. Neurol. 11:27. doi: 10.3389/fneur.2020.00027

Imaging Patterns of Toxic and Metabolic Brain Disorders

Illustration shows the most important general imaging patterns in toxic and metabolic brain disorders. White areas = areas of involvement. These include symmetric basal ganglia and/or thalami involvement (axial view) (A); symmetric dentate nuclei involvement (axial view) (B); prominent cortical gray matter involvement (axial view) (C); symmetric periventricular white matter involvement (with gray matter sparing) (axial view) (D); corticospinal tract involvement (axial view) (E); corpus callosum involvement (coronal view) (F); asymmetric white matter involvement (demyelinating disease pattern) (axial view) (G); parieto-occipital subcortical vasogenic edema (axial view) (H); and central pons involvement (axial view) (I).
Reference: https://doi.org/10.1148/rg.2019190016

Measuring Global Brain Atrophy with the Brain Volume/Cerebrospinal Fluid Index: Normative Values, Cut-Offs and Clinical Associations

Background: Global brain atrophy is present in normal aging and different neurodegenerative disorders such as Alzheimer's disease (AD) and is becoming widely used to monitor disease progression. Summary: The brain volume/cerebrospinal fluid index (BV/CSF index) is validated in this study as a measurement of global brain atrophy. We tested the ability of the BV/CSF index to detect global brain atrophy, investigated the influence of confounders, provided normative values and cut-offs for mild, moderate and severe brain atrophy, and studied associations with different outcome variables. A total of 1,009 individuals were included [324 healthy controls, 408 patients with mild cognitive impairment (MCI) and 277 patients with AD]. Magnetic resonance images were segmented using FreeSurfer, and the BV/CSF index was calculated and studied both cross-sectionally and longitudinally (1-year follow-up). Both AD patients and MCI patients who progressed to AD showed greater global brain atrophy compared to stable MCI patients and controls. Atrophy was associated with older age, larger intracranial volume, less education and presence of the ApoE ε4 allele. Significant correlations were found with clinical variables, CSF biomarkers and several cognitive tests. Key Messages: The BV/CSF index may be useful for staging individuals according to the degree of global brain atrophy, and for monitoring disease progression. It also shows potential for predicting clinical changes and for being used in the clinical routine.

Reference: Camila Orellana, Daniel Ferreira, J.-Sebastian Muehlboeck, Patrizia Mecocci, Bruno Vellas, Magda Tsolaki, Iwona Kłoszewska, Hilkka Soininen, Simon Lovestone, Andrew Simmons, Lars-Olof Wahlund, Eric WestmanMeasuring Global Brain Atrophy with the Brain Volume/Cerebrospinal Fluid Index: Normative Values, Cut-Offs and Clinical Associations. Neurodegener Dis (DOI: 10.1159/000442443)

Free Supplementary Material


Thalamic amnesia after infarct: the role of the mammillothalamic tract and mediodorsal nucleus

Objective: To improve current understanding of the mechanisms behind thalamic amnesia, as it is unclear whether it is directly related to damage to specific nuclei, in particular to the anterior or mediodorsal nuclei, or indirectly related to lesions of the mammillothalamic tract (MTT).
Methods: We recruited 12 patients with a left thalamic infarction and 25 healthy matched controls. All underwent a comprehensive neuropsychological assessment of verbal and visual memory, executive functions, language, and affect, and a high-resolution structural volumetric MRI scan. Thalamic lesions were manually segmented and automatically localized with a computerized thalamic atlas. As well as comparing patients with controls, we divided patients into subgroups with intact or damaged MTT.
Results: Only one patient had a small lesion of the anterior nucleus. Most of the lesions included the mediodorsal (n = 11) and intralaminar nuclei (n = 12). Patients performed worse than controls on the verbal memory tasks, but the 5 patients with intact MTT who showed isolated lesions of the mediodorsal nucleus (MD) only displayed moderate memory impairment. The 7 patients with a damaged MTT performed worse on the verbal memory tasks than those whose MTT was intact.


Conclusions: Lesions in the MTT and in the MD result in memory impairment, severely in the case of MTT and to a lesser extent in the case of MD, thus highlighting the roles played by these 2 structures in memory circuits.
Reference: Neurology10.1212/WNL.0000000000002226  (Full text)

Disruption of posteromedial large-scale neural communication predicts recovery from coma

Objective: We hypothesize that the major consciousness deficit observed in coma is due to the breakdown of long-range neuronal communication supported by precuneus and posterior cingulate cortex (PCC), and that prognosis depends on a specific connectivity pattern in these networks.
Methods: We compared 27 prospectively recruited comatose patients who had severe brain injury (Glasgow Coma Scale score <8; 14 traumatic and 13 anoxic cases) with 14 age-matched healthy participants. Standardized clinical assessment and fMRI were performed on average 4 ± 2 days after withdrawal of sedation. Analysis of resting-state fMRI connectivity involved a hypothesis-driven, region of interest–based strategy. We assessed patient outcome after 3 months using the Coma Recovery Scale–Revised (CRS-R).
Results: Patients who were comatose showed a significant disruption of functional connectivity of brain areas spontaneously synchronized with PCC, globally notwithstanding etiology. The functional connectivity strength between PCC and medial prefrontal cortex (mPFC) was significantly different between comatose patients who went on to recover and those who eventually scored an unfavorable outcome 3 months after brain injury (Kruskal-Wallis test, p < 0.001; linear regression between CRS-R and PCC-mPFC activity coupling at rest, Spearman ρ = 0.93, p < 0.003).


Conclusion: In both etiology groups (traumatic and anoxic), changes in the connectivity of PCC-centered, spontaneously synchronized, large-scale networks account for the loss of external and internal self-centered awareness observed during coma. Sparing of functional connectivity between PCC and mPFC may predict patient outcome, and further studies are needed to substantiate this potential prognosis biomarker.
Reference: Neurology10.1212/WNL.0000000000002196 (Full text)

Comparison of 3T and 7T Susceptibility-Weighted Angiography of the Substantia Nigra in Diagnosing Parkinson Disease

BACKGROUND AND PURPOSE: Standard neuroimaging fails in defining the anatomy of the substantia nigra and has a marginal role in the diagnosis of Parkinson disease. Recently 7T MR target imaging of the substantia nigra has been useful in diagnosing Parkinson disease. We performed a comparative study to evaluate whether susceptibility-weighted angiography can diagnose Parkinson disease with a 3T scanner.
MATERIALS AND METHODS: Fourteen patients with Parkinson disease and 13 healthy subjects underwent MR imaging examination at 3T and 7T by using susceptibility-weighted angiography. Two expert blinded observers and 1 neuroradiology fellow evaluated the 3T and 7T images of the sample to identify substantia nigra abnormalities indicative of Parkinson disease. Diagnostic accuracy and intra- and interobserver agreement were calculated separately for 3T and 7T acquisitions.
RESULTS: Susceptibility-weighted angiography 7T MR imaging can diagnose Parkinson disease with a mean sensitivity of 93%, specificity of 100%, and diagnostic accuracy of 96%. 3T MR imaging diagnosed Parkinson disease with a mean sensitivity of 79%, specificity of 94%, and diagnostic accuracy of 86%. Intraobserver and interobserver agreement was excellent at 7T. At 3T, intraobserver agreement was excellent for experts, and interobserver agreement ranged between good and excellent. The less expert reader obtained a diagnostic accuracy of 89% at 3T.
CONCLUSIONS: Susceptibility-weighted angiography images obtained at 3T and 7T differentiate controls from patients with Parkinson disease with a higher diagnostic accuracy at 7T. The capability of 3T in diagnosing Parkinson disease might encourage its use in clinical practice. The use of the more accurate 7T should be supported by a dedicated cost-effectiveness study.

Full text